Outcomes
Discover the experiences and successes of St. Scholastica programs and students. Explore our rankings, graduation rates and other outcomes to get a clear picture of the education St. Scholastica provides.
Our students leave with the knowledge and tools they need to succeed, both as employees and responsible citizens. Grounded in a strong liberal arts foundation, they are prepared to think critically and respond to a changing world.
St. Scholastica’s rigorous academics engage all students in meaningful educational experiences in and outside the classrooms, from firsthand research, clinicals and internships to study abroad and volunteer opportunities. Our emphasis on experiential learning helps prepare our students to succeed in their chosen fields.

98% of graduates are employed, pursuing continuing education, in the military or volunteering within six months of graduation.*

Saints’ early post-graduation earnings rank #1 for Minnesota public and private colleges.

90% of first-year students participate in hands-on service, community learning or research with faculty.**
*Survey data reported 383 respondents out of 643 graduates.
**Survey data reported 157 of 172 respondents out of 819 seniors.
Rankings
Best National Universities
Best Midwestern Colleges
Princeton Review included St. Scholastica on its 2025 Best Midwestern colleges list.
America’s Best Colleges
Money magazine included St. Scholastica on its 2024 “America’s Best Colleges” list, based on educational quality, affordability and student outcomes.
Best in Minnesota
University HQ included St. Scholastica on its Best Bachelor’s Degrees in Minnesota list. Additionally, University HQ recognized the College on its Best Master’s Degrees in Minnesota list.
Best Online Catholic Colleges
Intelligent.com recognized St. Scholastica with the Best Benedictine Option Award on its Best Online Catholic Colleges list.
Best Graduate Schools
Best Graduate Schools by U.S. News & World Report.

Our Saints Go Everywhere
Our graduates can be found doing meaningful work from Duluth and the Twin Cities, to Washington DC, New York and around the globe. Look for them in Fortune 500 corporations or successful small businesses everywhere you go!
- 3M
- Allete
- Apple
- Duluth Public Schools
- Catholic Charities
- Cedars-Sinai Medical Center
- CentraCare Health System
- Children’s Hospitals and Clinics of Minnesota
- Essentia Health
- Hazelden Betty Ford Foundation
- Mayo Clinic
- Minnesota House of Representatives
- Minnesota Twins
- Minnesota Vikings
- National Science Foundation
- Sanford Health
- Target
- University of Minnesota Medical Center
- U.S. Department on Veterans Affairs


Undergraduate Student Outcomes
The St. Scholastica experience is distinguished by the school’s Catholic Benedictine values. Undergraduate students will encounter them through the traditions and practices of campus life. Our values play a role in athletics, activities and especially in academics.
In addition to our values, challenging academics are crucial to the college experience at St. Scholastica. We inspire student success by stressing the importance of academic effort and establishing high expectations for student performance.
Best Bachelor Degrees in Minnesota
University HQ included St. Scholastica in the top ten in its Best Bachelor’s Degrees in Minnesota list.
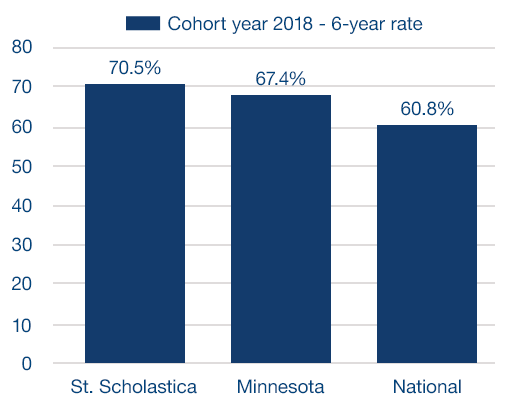
Graduation Rate Above National Average
St. Scholastica’s traditional 6-year graduation rate surpassed both the average Minnesotan graduation rate as well as the national graduation rate.
Strong Sports Culture
39% of undergraduate students at St. Scholastica participate in a campus sport.
Undergraduate Student Graduation, Retention and Exam Rates
These graduation and retention rates show the percentage of undergraduate traditional, non-traditional and graduate students during a time period and by program. And, the exam pass rates showcase the percentage of licensure pass rates broken out by their corresponding population and program.
Traditional Undergraduate Students
Retention Rates
The retention rate shows the percentage of bachelor-seeking students by program.
| Program | Retention |
|---|---|
| Biology (BA) | 100% |
| Business Management (BA) | 83% |
| Computer Information Systems (BS) | 93% |
| Exercise Physiology (BS) | 77% |
| Finance (BS) | 80% |
| Nursing (BS) | 83% |
| Pre-Physical Therapy | 77% |
| Psychology (BA) | 87% |
*Retention rates are defined as our fall 2023 bachelor-seeking program populations and if they retained in the fall of 2024. Note that this is not a complete listing of majors but a variety of our traditional programs. Majors listed have ten or more students in the incoming class.
Fall to Fall Retention Rate for First-Time, Degree-Seeking Students
The retention rate is the percent of first-year students who returned the next fall for their sophomore year.
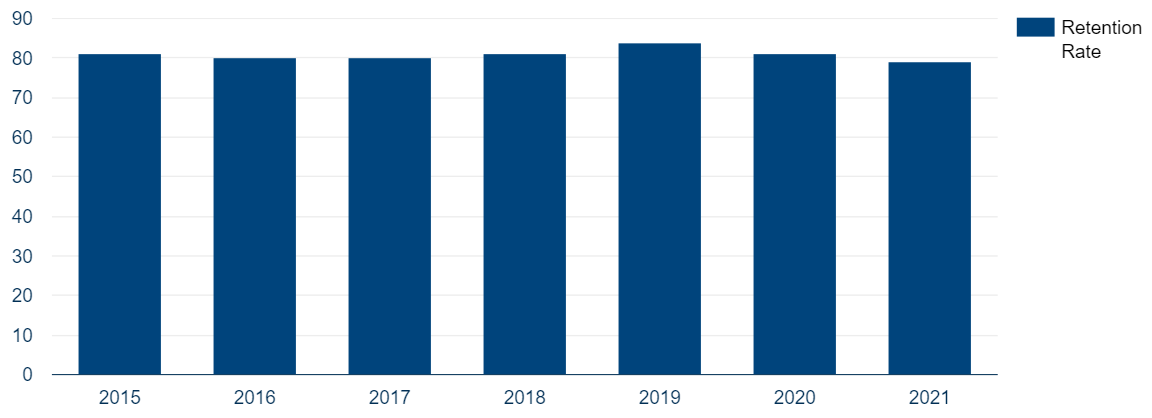
* The average retention rate for the fall 2022 cohort at Minnesota and Wisconsin postsecondary institutions was 77.3%. SOURCE: U.S. Department of Education, National Center for Education Statistics, Integrated Postsecondary Education Data System (IPEDS), Fall Enrollment component.
Graduation Rates
Graduation rates show the number of first-time students who graduated from a particular program.
| Program | Rate |
|---|---|
| Biology (BS) | 88% |
| Business Management (BA) | 85% |
| Elementary Education (BS) | 71% |
| Exercise Physiology (BS) | 71% |
| Nursing (BS) | 71% |
| Pre-Medicine | 73% |
| Pre-Physical Therapy | 100% |
| Psychology (BA) | 74% |
| Social Work (BA) | 83% |
*Traditional 6-year program graduation rates are calculated using our fall 2018 cohort of new first-year students with a completion deadline of Aug. 31, 2024. Note that this is not a complete listing of majors but a variety of our traditional programs. Majors listed have ten or more students in the incoming class.
Graduation rates show the number of students who graduate within a certain time period from when they start. Our four-year graduation rate is higher than public colleges and universities in Minnesota and on par with peer private colleges and universities throughout the state. Our six-year graduation rate is also above average.
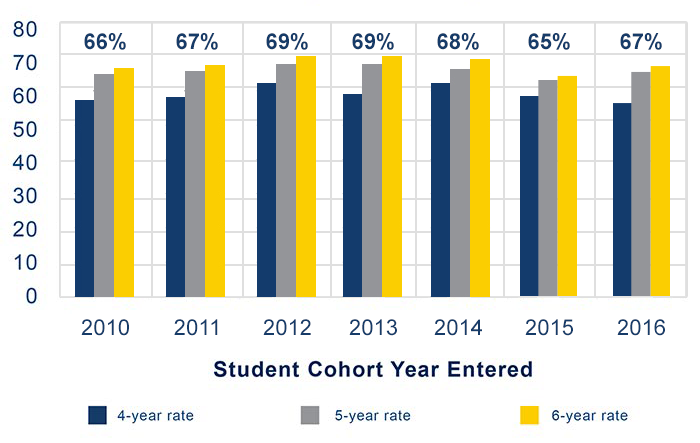
Graduation Rate Comparison
*The average six-year graduation rate for the 2016 cohort at Minnesota and Wisconsin postsecondary institutions was 66%. SOURCE: U.S. Department of Education, National Center for Education Statistics, Integrated Postsecondary Education Data System (IPEDS), Graduation Rates component.
Licensure Exam Pass Rates
| Program | Year | Rate |
|---|---|---|
|
Registered Nursing |
2023 |
82.8% |
|
Social Work |
2023 |
51.9% |
Exam rates include both traditional and non-traditional undergraduate students. The rate is calculated based on public information made available to the institution.

Graduate Student Outcomes
St. Scholastica has over 35 graduate and certificate programs. While many of our graduate students join us from Minnesota or Wisconsin, we also have students all across the United States and the globe. They bring diverse perspectives to our community and have different student experiences, depending on their program. Some are fully online and some learn in person at our Duluth or St. Cloud campuses.
Our graduate students have an average retention rate of 93.7 % and an 81.9% graduation rate, reflecting the success of our programs. Our degrees and certificates focus on areas of study that positively impact the world, equipping our students with the skills and knowledge needed to create meaningful change.
Highly ranked OT, PT and Social Work programs
Best Graduate Schools by U.S. News & World Report. Graduate programs in occupational therapy, physical therapy and social work ranked among leading graduate school programs across the nation.
Highest ranked MEd in Minnesota
Best Online Education Programs by U.S. News & World Report. The Master of Education program ranked highest among all Minnesota schools and in the top third of schools nationwide.
Best MS degree in HIM
Best Accredited Colleges lists St. Scholastica as having one of the Best Master’s Degrees in Health Information Management. St. Scholastica is one of the top schools in the nation and the top private school in Minnesota to earn this recognition.